
Equipment Checkout KPIs: The Metrics That Matter Most
What are the metrics that universities use to measure their media store services? Here are the key indicators that many rely on to monitor activity levels and performance over each academic year or semester:
Utilization rate of resources
This relates to the percentage of available time that resources are in use
Total bookings or checkouts
Each unit relates to a single reservation or instant checkout from the store. It involves one or more items for each booking or checkout
Number of students using the service / student reach
This is the total number of unique student users. It’s also useful to view this figure as a % of all students in the cohort, year, department etc.
Inventory size
This counts the full range of items that are on offer for student and staff use
Amount of new items added
Stores continue to purchase and add new kit, this metric captures this investment
Asset value under management
Total purchase or replacement value of all items in the store
Total times items are used
Number of times items are checked out and used (i.e. usages, not unique items)
With this data, university departments can assess the value of the services they offer. They can use the data in management reporting to reveal the student impact of services delivered and support return on investment (ROI) analysis.
Some university departments circulate a selection of stats more widely as a way of publicizing the value of the services. This in turn can help promote even greater resource usage – a ‘vital sign’ of a thriving service.
The analytics can also go towards bids for better funding of equipment and services – read more here.
A closer focus on utilization
The utilization rate is probably the most commonly used metric monitored by media stores in Higher Ed. It’s possible to see the overall utilization rate of a store’s entire equipment range in the Connect2 system. This figure gives an indicator of service effectiveness as a whole and whether it’s going up or down over time.
However, on its own it provides limited insight on how best to manage the types of equipment included. After all, stores may have hundreds or thousands of pieces under management for a range of different uses.
One issue is that a store may have an excess of lower value identical items (e.g. cables, adaptors or batteries) that will drag on the overall utilization metric and keep it at what looks like a disappointingly low rate. Nonetheless, inventory managers making decisions around when to retire or archive equipment are likely to find this data still useful.
Utilization of higher value items and core categories of equipment are probably more important analytics to measure and understand. What percentage of available time is a camera in use? What about a collection of identical cameras?
Reporting in Connect2 provides utilization calculations, enabling you to view and compare usage of selected resources or categories. Here’s an example extract of utilization metrics showing data for a collection of 10 camcorders:
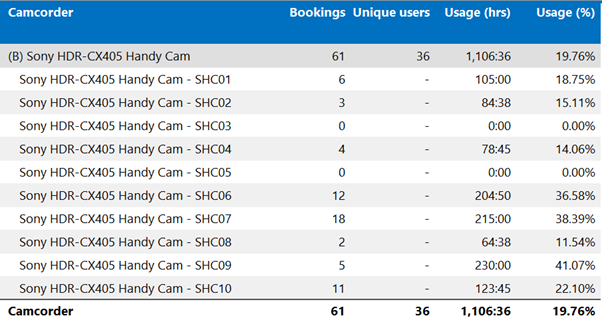
So for this collection of camcorders, there’s an utilization rate of just under 20%. The Connect2 report also shows how many times the equipment was checked out to users over the period – 61 times in this example – and how many unique users were involved. Both provide useful context to the overall utilization figure.
Utilization over time
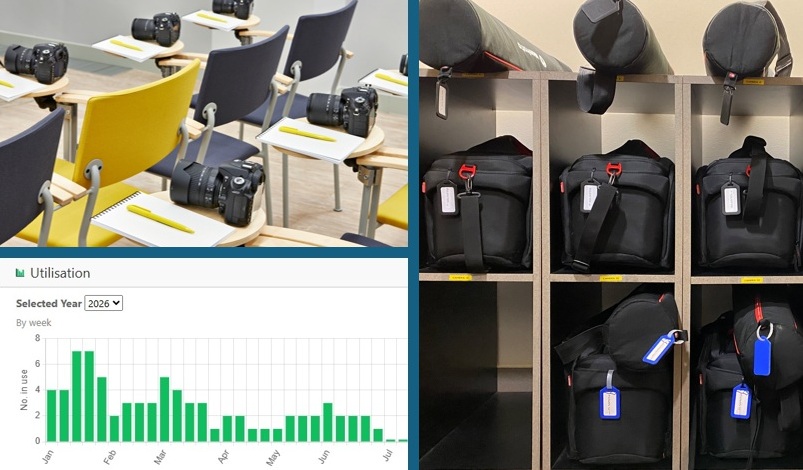
It’s useful to view utilization data along a timeline, to see if there are any periods when essential items are being used at full capacity. This is what Connect2 shows you:
The maximum number of resources in a collection that were in concurrent use
each week over a selected period
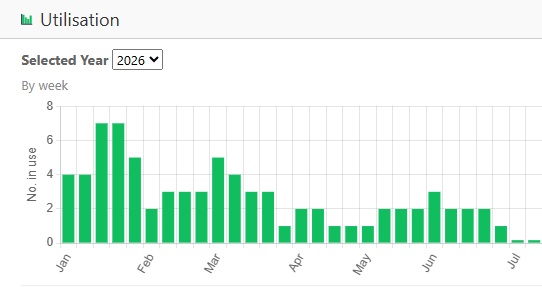
This chart visualises utilization of a collection of 8 resources for each successive week. It’s able to reveal the student impact of usage patterns, for example if it’s possible some students are ever unable to access an item due to spikes in demand. In the above example, we can see that in late January, a rise in bookings caused the resource type to be at just under full capacity, with 7 of the 8 resources in concurrent use. This offers much greater visibility than viewing a single utilization percentage figure for a whole semester or year. Together with the utilization report discussed above, it rounds out the picture on resource usage to support better department planning and decision making.
FAQs
Why is the utilization rate important when managing university equipment?
The utilization rate measures the overall effectiveness of the service in terms of usage of the resources included. It is a useful metric to monitor over time.
How do universities track equipment loans?
Equipment checkout system software provides a central database of all lending and checkout activity to understand volumes of usage and the status of all items.
What KPIs should an equipment checkout service measure?
Utilization rate of resources; Total bookings or checkouts; Number of unique users; Inventory size; Asset value under management; Amount of new items added; Total times items are used.
How can equipment lending data support funding requests?
Robust data on resource usage demonstrates ROI for existing equipment and should be part of a business case for investing in more. It can also track usage for specific modules or projects to show how it contributes to program success.
What reports should university equipment managers produce?
Untilization reports for key resource collections and number of unique users are the mainstay of good regular reporting. Further analytics that highlight usefulness of the service use KPIs such as total number of uses, bookings or checkouts. This data can help support better recognition of the service’s performance and reach.
Conclusion
Being able to understand the utilization of resources is an important aspect of managing a media store. Additional analytics can lend deeper insight into store footfall and service effectiveness for supporting student projects and assignments. It can also inform equipment inventory decisions for better lifecycle management of resources.
The data can be used in management reporting and funding bids, and can also encourage higher service utilization when used to publicize services. Next time, we will provide a handy infographic to populate with store data and use for this purpose. Watch this space!!